Tacoma's Tree Canopy Cover
In 2010, students at the University of Washington received a Grant from the DNR Urban and Community Forestry Program to analyze 2009 Light Detection and Ranging (LiDAR) data for the City of Tacoma Limits. This 2011 analysis concluded that Tacoma's Tree Canopy covered approximately 19% of the City's land area in 2009.
Tacoma Tree Canopy 2011 Report
In 2018, the King Conservation District received a grant through the USDA Forest Service Urban and Community Forestry Program, administered through the State of Washington Department of Natural Resources, to analyze urban Tree Canopy Coverage (UTC) throughout communities across the Puget Sound. Through this grant, the consulting firm Plan-It Geo completed an analysis of higher resolution, 2017 LiDAR, to provide Tacoma with an updated approximation of our tree canopy cover.
Tacoma Tree Canopy 2018 Fact Sheet
Tacoma Tree Canopy 2018 Report
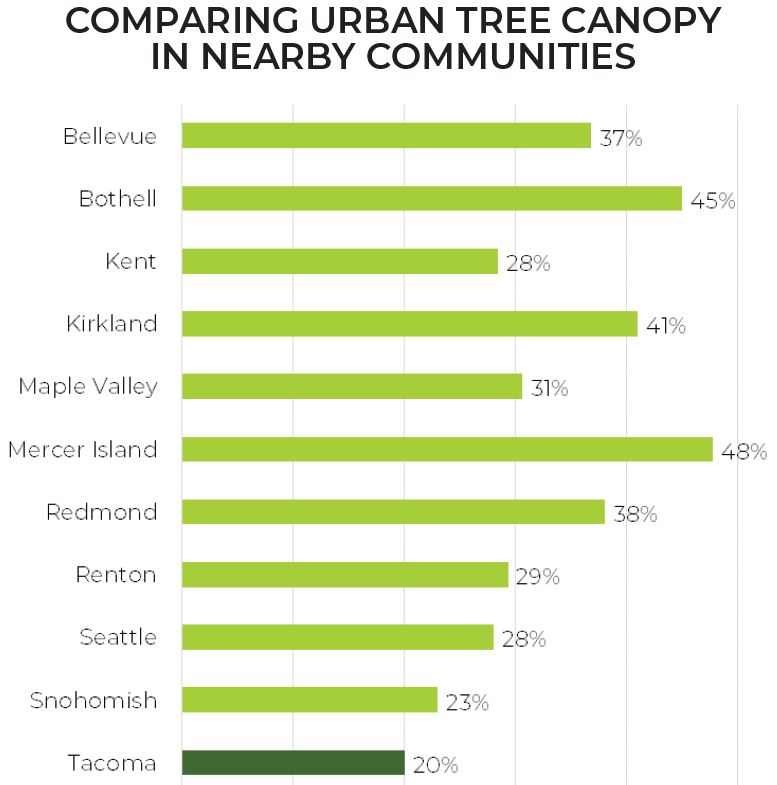
This report concluded that Tacoma, with 20% of the land area covered by tree canopy, has the least amount of tree canopy as a percentage of land cover for all communities assessed in the Puget Sound Region.

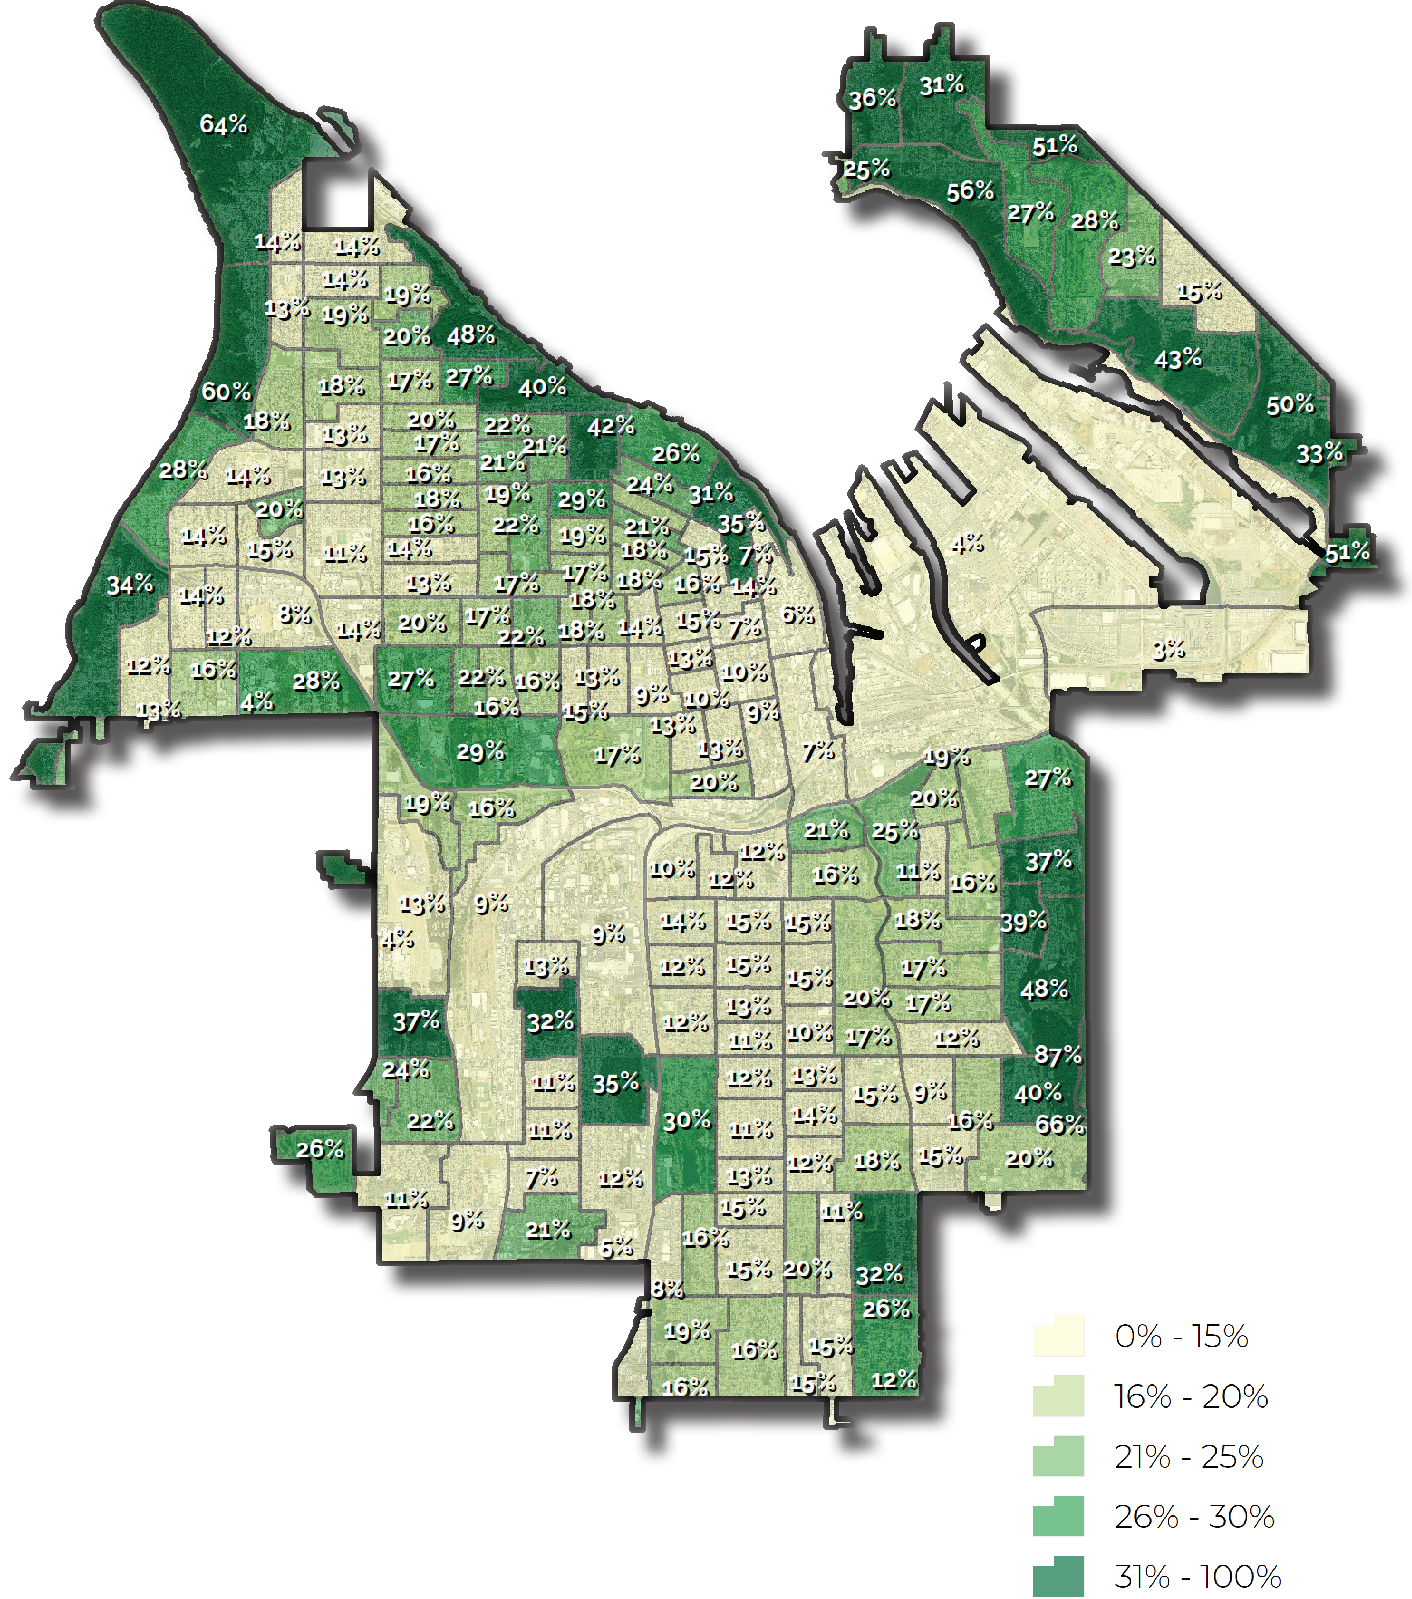
In addition to Tacoma's Tree Canopy being disproportionately low in the Puget Sound Region, the analysis further recognizes that within the City of Tacoma, tree canopy is not distributed evenly, with some census blocks experiencing as low as 3% tree canopy cover, whole others have as high as 64%.
Tacoma's 2017 Canopy Cover Distribution

The City recognizes that the wide ranging benefits of trees and parks are not spread evenly across our community, with those living in lower-opportunity neighborhoods having the least canopy coverage. To learn more about the disparities between high and low opportunity neighborhoods, please visit the Tacoma Community Forestry Map.
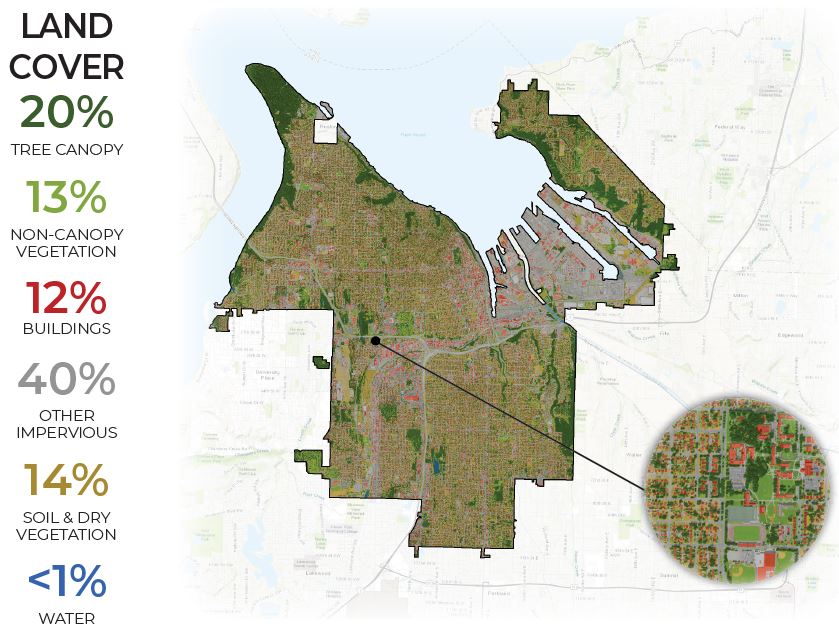
Tacoma's 2017 Land Cover Distribution
Further land cover classification results of this study indicated that in 2017, the city of Tacoma landcover contained 20 percent urban tree canopy; 13 percent non-canopy vegetation; 14 percent soil/dry vegetation; 52 percent impervious surfaces; and less than 1 percent water.

Tacoma's Canopy Cover by Land Use
It is generally recognized that some land uses are more conducive to growing trees than others. For instance, where as parks and natural areas typically have forested lands, places like commercial cores may have more pavement and buildings. Using the data from above and Tacoma's existing zoning and current land uses, here’s a snapshot of canopy cover by land use.
| Single Family Residential |
46% |
17% |
|
|
Multi-Family Residential (High Density)
|
1% |
12% |
|
|
Multi-Family Residential (Low Density)
|
5% |
16% |
|
|
Manufacturing/Industrial
|
15% |
4% |
|
|
Commercial/Mixed-Use
|
7% |
9% |
|
|
Tacoma Mall Regional Growth Center
|
2% |
10% |
|
|
Downtown Regional Growth Center
|
3% |
7% |
|
|
Major Institution
|
2% |
10% |
|
|
Parks and Open Space
|
16% |
56% |
|
| Shoreline |
3% |
17% |
|
Tacoma's Estimated 2017 Possible Tree Planting Area
Results of this 2017 study indicate that 6,406 acres within Tacoma are covered with urban tree canopy, whereas 4,064 acres are covered with other vegetation where it would be possible to plant trees. This Possible Planting Area (PPA) makes up 13 percent of the city, and can be seen as "low hanging fruit" areas to consider planting trees without significant infrastructure changes. The remaining 21,006 acres (67% of land area) were considered currently unsuitable for tree planting, include recreational sports fields, golf course playing areas, impervious surfaces, and areas of bare soil and dry vegetation.
Recommendations
The results of this analysis can be used to develop a continuing strategy to protect and expand Tacoma’s urban forest. The UTC and PPA metrics should be used as a guide to determine where the City has been successful in protecting and expanding its urban forest resource, while also targeting areas to concentrate future efforts based on needs, benefits, and available planting space. Tacoma can use these results to ensure that their urban forest policies and management practices continue to prioritize its maintenance, health, and growth.